… Where insights meet automation and innovation
Welcome to Data Trekking, a blog dedicated to sharing practical solutions, insightful tips, and recommended practices for Power BI, Power Automate, and Microsoft Fabric. This blog serves as a guide to navigating the complexities of these powerful tools.
Every post here is rooted in hands-on experience, tackling the same challenges I’ve faced in my own projects. I aim to provide not only solutions but also a deeper understanding of how to effectively implement these technologies in real-world scenarios.
This blog is a valuable resource for actionable insights, detailed tutorials, and recommended practices that can make a genuine difference in your work, whether you are just starting out or looking to enhance your existing knowledge and skills.


Data can be pretty messy.
In fact, in most cases it is pretty messy.
A lot of data analysts and engineers complain about chaotic data.
But.. how to say.. that is our job.
To organize data.
- Data Visualizations (2)
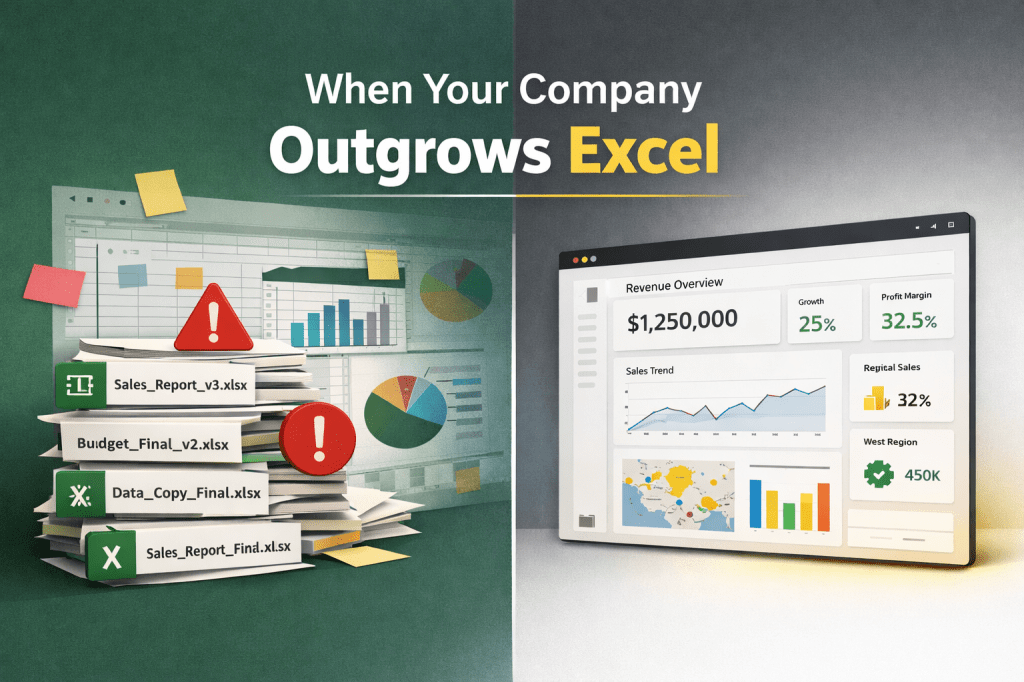
- Excel (1)
- Power Automate (1)
- Power BI (1)
- Power BI Rest API (5)
- Power BI Service (5)
- Power Query (2)
- Report Design (3)
- Rest API (3)
- Security & Permissions (3)
- Sharing Content (2)
ac vs py app-permissions automate-tasks azure bar chart build-permissions business-intelligence card visual conditional formatting copy-report create-report data-analytics data-engineering data visualization dax-studio download-greyed-out download-report Excel excel-export export-data external-users external user fabric free-user markers microsoft microsoft fabric microsoft power bi performance-analyzer power-bi power-bi-external-tools power-bi-service power bi developer Power Query premium capacity report-permissions rls rls-role semantic-model semantic-model-permissions sensitive data share-report switch-dataset tenant-id unpivot